之前写过一篇c++ 分析 gperftools 总结
对普通的性能优化来说,gperftools已经足够了
但是如果要深入优化,还是需要借助linux内置的perf工具
这个工具的功能包括但不限于:
协助优化代码中的cpu热点
gpertools最多只能精确到某一行热点,perf是汇编级别的,因此可以协助优化生成的汇编代码
协助优化代码的分支预测命中率
协助优化代码的cpu高速缓存命中率
协助优化代码中对内核部分的使用
协助理解代码运行时在linux的调度情况
安装
1 apt-get install -y linux-tools-$(uname -r) linux-tools-generic
perf本体的安装比较简单,但是要充分利用perf,深入到glibc甚至内核的话,需要安装各种提供符号的调试软件包
ubuntu下debug包安装
根据官方文档
1
2
3
4
5
6
7
~# echo "deb http://ddebs.ubuntu.com $(lsb_release -cs) main restricted universe multiverse deb http://ddebs.ubuntu.com $(lsb_release -cs)-updates main restricted universe multiverse deb http://ddebs.ubuntu.com $(lsb_release -cs)-proposed main restricted universe multiverse" | \ tee -a /etc/apt/sources.list.d/ddebs.list ~# apt install -y ubuntu-dbgsym-keyring ~# apt-key adv --keyserver keyserver.ubuntu.com --recv-keys F2EDC64DC5AEE1F6B9C621F0C8CAB6595FDFF622 ~# apt-get update
libstd++和libc++的debug包安装
根据how-to-install-libstdc6-debug-symbols-on-ubuntu-20-04
先查看自己的libstdc++版本
1
2
~# dpkg --list | grep libstdc++ libstdc++6:amd64 10.3.0-1ubuntu1~20.04 amd64 GNU Standard C++ Library v3
是libstdc++6,所以
1 apt-get install -y libstdc++6-dbgsym
对libc++同理
1
2
~# dpkg --list | grep libc++ libc++1-10:amd64 1:10.0.0-4ubuntu1 amd64 LLVM C++ Standard library
是libc++1-10,所以
1 apt-get install -y libc++1-10-dbgsym
现在gdb就可以深入到string内部了
内核debug包和源码包安装
内核debug包安装很简单,利用uname确定linux的版本即可
1
2
3
~# uname -r 5.4.0-48-generic ~# apt-get install -y linux-image-$(uname -r)-dbgsym
但是源码包需要debug包的Version信息才能安装,因此需要自己选定版本号,单行命令安装如下
1 apt-get install -y linux-source-$(uname -r | cut -f1 -d-)=$(apt-cache show linux-image-$(uname -r)-dbgsym|grep Version|cut -f2 -d' ')
命令拆分如下
1
2
3
4
5
6
7
8
~# apt-cache show linux-image-$(uname -r)-dbgsym ... Version: 5.4.0-48.52 ... ~# apt list --all-versions linux-source-5.4.0|grep 5.4.0-48.52 linux-source-5.4.0/focal-updates,focal-security,now 5.4.0-48.52 all ~# apt install -y linux-source-5.4.0=5.4.0-48.52 ~# cd /usr/src/linux-source-5.4.0 && tar xvf linux-source-5.4.0.tar.bz2
使用
perf的用途非常广,使用list子命令可以展示所有支持的event
1
2
3
4
5
6
7
8
9
10
11
12
13
14
15
16
17
18
19
20
21
22
23
24
25
~# perf list List of pre-defined events (to be used in -e): branch-instructions OR branches [Hardware event] branch-misses [Hardware event] bus-cycles [Hardware event] cache-misses [Hardware event] cache-references [Hardware event] cpu-cycles OR cycles [Hardware event] instructions [Hardware event] ref-cycles [Hardware event] L1-dcache-load-misses [Hardware cache event] L1-dcache-loads [Hardware cache event] L1-dcache-stores [Hardware cache event] L1-icache-load-misses [Hardware cache event] LLC-load-misses [Hardware cache event] LLC-loads [Hardware cache event] LLC-store-misses [Hardware cache event] LLC-stores [Hardware cache event] branch-load-misses [Hardware cache event] branch-loads [Hardware cache event] dTLB-load-misses [Hardware cache event] dTLB-loads [Hardware cache event] dTLB-store-misses [Hardware cache event]
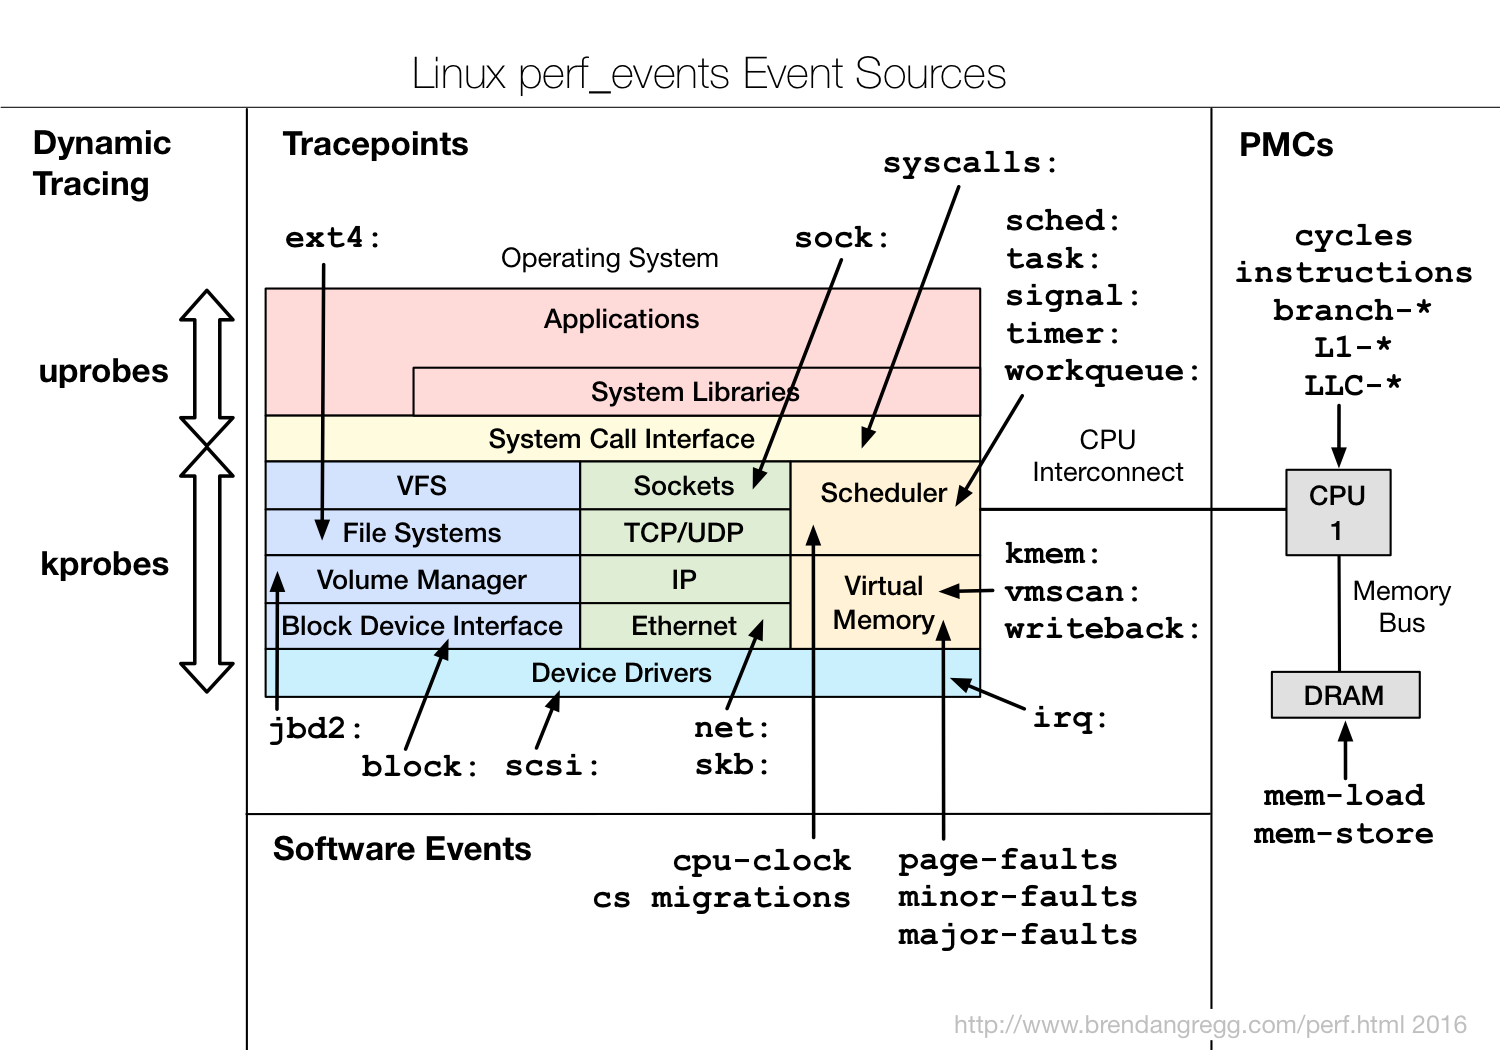
这里只展示了一部分,下图展示了perf的event对应linux的各部分
img
命令行使用
简单介绍一下,例如对ls指令进行perf,详细用法可以看brendangregg
stat子命令可以查看一个粗略情况
1
2
3
4
5
6
7
8
9
10
11
12
13
14
15
16
~# perf stat ls Performance counter stats for 'ls': 0.80 msec task-clock # 0.215 CPUs utilized 2 context-switches # 0.003 M/sec 0 cpu-migrations # 0.000 K/sec 91 page-faults # 0.114 M/sec 2056567 cycles # 2.574 GHz 1552259 instructions # 0.75 insn per cycle 315784 branches # 395.212 M/sec 14554 branch-misses # 4.61% of all branches 0.003712417 seconds time elapsed 0.001071000 seconds user 0.000000000 seconds sys
可以看到上下文切换,运行了多少指令,分支预测的命中率等等
record子命令可以录入更详细的一些情况
1
2
3
~# perf record -g -F 99 ls [ perf record: Woken up 1 times to write data ] [ perf record: Captured and wrote 0.012 MB perf.data (5 samples) ]
这里-g是为了生成堆栈信息,-F是采样频率,采样频率越高对程序本身的分析影响越大
此时生成了一个perf.data文件,可以通过report,annotate,script命令查看,这里以perf report举例
1
2
3
4
5
6
7
8
9
10
~# perf report --stdio # Samples: 5 of event 'cycles' # Event count (approx.): 20796061 # # Overhead Command Shared Object Symbol # ........ ....... ................ ............................ # 99.78% ls [aufs] [k] 0x0000000000014975 0.22% perf [kernel.vmlinux] [k] __x86_indirect_thunk_rax 0.00% perf [kernel.vmlinux] [k] native_write_msr
封装支持单个函数perf
perf本身作为一个命令行工具,是只能针对整个程序来分析的
这样一些准备工作也会被误统计在内,并且也不利于多个函数对比性能差异
因此我对perf进行了简单的封装来便于使用
思路来自perf-stat-for-part-of-program
1
2
3
4
5
6
7
8
9
10
11
12
13
14
15
16
17
18
19
20
21
22
23
24
25
26
27
28
29
30
31
32
33
34
35
36
37
38
39
40
41
42
43
44
45
46
47
48
49
50
51
52
53
54
55
56
57
58
59
60
61
62
63
64
65
66
67
68
69
70
71
72
73
namespace profile{#include <unistd.h> #include <stdio.h> #include <signal.h> inline void perfFork (const std::function<void ()> &cb, const std::function<string(int )> &pid2Str) static atomic<int > l = {0 }; assert (l++ == 0 ); int pid = getpid (); int cpid = fork(); string fileName; if (cpid == 0 ) { string command = pid2Str (pid); execl ("/bin/sh" , "sh" , "-c" , command.c_str (), nullptr ); }else { setpgid (cpid, 0 ); sleep (1 ); cb (); kill (-cpid, SIGINT); sleep (1 ); } l--; } void perfStat (const string &filePrefix, const std::function<void ()>& cb) cout << "perf stat " << filePrefix << " start" << endl; string filePath = "/tmp/" + filePrefix + "_stat.log" ; perfFork (cb, [&filePath](int pid) { stringstream ss; ss << "echo 0 > /proc/sys/kernel/nmi_watchdog && " "perf stat -e task-clock,context-switches,cpu-migrations,page-faults,cycles," "instructions,branches,branch-misses,cache-references,cache-misses,L1-dcache-loads,L1-dcache-load-misses,L ss << " -p " << pid << " > " << filePath << " 2 >&1 "; return ss.str(); }); string result; fstream f(filePath); if (!f.is_open()) { cout << LOGV(filePath) << " open failed" << endl; return; } copy(std::istreambuf_iterator<char>(f), std::istreambuf_iterator<char>(), std::ostreambuf_iterator<char>(cout)); perfFork(cb, [&filePath](int pid) { stringstream ss; ss << " echo 1 > /proc/sys/kernel/nmi_watchdog"; return ss.str(); }); cout << " perf stat " << filePrefix << " end" << endl; } void perfRecord(const string &filePrefix, const std::function<void()>& cb, const string& event) { cout << " perf record " << filePrefix << LOGV(event) << " start" << endl; string filePath = " /tmp/" + filePrefix + " _record.perf.data"; perfFork(cb, [&filePath, &event](int pid) { stringstream ss; if (event.empty()) { ss << " perf record -F 99 -g -e task-clock,context-switches,cpu-migrations,page-faults,cycles," " instructions,branches,branch-misses,cache-references,cache-misses"; }else { ss << " perf record -F 99 -g -e " << event; } ss << " -p " << pid << " -o " << filePath << " > /dev/null 2 >&1 "; return ss.str(); }); cout << " perf stat " << filePrefix << LOGV(event) << " end" << endl; cout << " Run any of this following" << endl; cout << " perf report -i " << filePath << endl; cout << " perf annotate -i " << filePath << endl; cout << " If need flamegraph, specify event when call perfRecord" << endl; cout << " perf script -i " << filePath << " |/root/FlameGraph/stackcollapse-perf.pl|/root/FlameGraph/flamegraph.pl > " << filePath << " .svg" << endl; } }//namespace profile end
下面就以cpu高速缓存命中率的优化来看perf的用法
例子:优化cpu高速缓存命中率
1 2 3 4 5 6 7 8 9 10 11 12 13 14 15 16 17 18 19 20 21 22 23 24 25 26 27 28 29 30 31 32 33 34 #include <cstring> const int64_t size = 10000 ;int64_t vs[size][size];int main () for (auto i = 0 ; i < size;i++) { for (auto j = 0 ;j < size;j++) { vs[i][j] = 0 ; } } auto innerFirstF = []() { int64_t sum = 0 ; for (auto i = 0 ;i < size;i++) { for (auto j = 0 ;j < size;j++) { sum += vs[i][j]; } } }; auto outerFirstF = []() { int64_t sum = 0 ; for (auto j = 0 ;j < size;j++) { for (auto i = 0 ;i < size;i++) { sum += vs[i][j]; } } }; profile::perfStat ("outerFirst_test" , outerFirstF); profile::perfStat ("innerFirst_test" , innerFirstF); }
innerFirst对二维数组按行访问,outerFirstF对二维数组按列访问
这两个lambda哪个执行的更快呢?
1
2
3
4
5
6
7
8
9
10
11
12
13
14
15
16
17
18
19
20
21
22
23
24
25
26
27
28
29
30
31
32
33
34
35
36
37
38
39
40
41
42
43
44
perf stat outerFirst_test start Performance counter stats for process id '55547': 1907.26 msec task-clock # 0.668 CPUs utilized 4 context-switches # 0.002 K/sec 0 cpu-migrations # 0.000 K/sec 1 page-faults # 0.001 K/sec 4935944518 cycles # 2.588 GHz (39.60%) 1484281008 instructions # 0.30 insn per cycle (49.67%) 216467939 branches # 113.497 M/sec (59.73%) 25665 branch-misses # 0.01% of all branches (59.78%) 172501006 cache-references # 90.445 M/sec (59.99%) 13511580 cache-misses # 7.833 % of all cache refs (60.20%) 614233484 L1-dcache-loads # 322.051 M/sec (39.43%) 202013498 L1-dcache-load-misses # 32.89% of all L1-dcache hits (20.09%) 172090035 LLC-loads # 90.229 M/sec (19.88%) 13728104 LLC-load-misses # 7.98% of all LL-cache hits (29.74%) 2.853302550 seconds time elapsed perf stat outerFirst_test end perf stat innerFirst_test start Performance counter stats for process id '55547': 306.90 msec task-clock # 0.246 CPUs utilized 3 context-switches # 0.010 K/sec 0 cpu-migrations # 0.000 K/sec 1 page-faults # 0.003 K/sec 794022115 cycles # 2.587 GHz (37.57%) 1403810285 instructions # 1.77 insn per cycle (47.99%) 202822088 branches # 660.873 M/sec (58.41%) 13848 branch-misses # 0.01% of all branches (59.72%) 836003 cache-references # 2.724 M/sec (61.02%) 462287 cache-misses # 55.297 % of all cache refs (62.32%) 612783117 L1-dcache-loads # 1996.686 M/sec (36.37%) 12809356 L1-dcache-load-misses # 2.09% of all L1-dcache hits (19.43%) 524248 LLC-loads # 1.708 M/sec (18.25%) 883747 LLC-load-misses # 168.57% of all LL-cache hits (27.37%) 1.245627548 seconds time elapsed perf stat innerFirst_test end
可以看到按列访问执行时间是按行访问的两倍
按列访问的L1缓存的miss率是32.89%,而按行访问的L1缓存的miss率只有2.09%
这是因为高速缓存一次性会缓存多个数据,按行访问的局部性更好
但是按行访问的cache-misses达到了55.297 %,远高于按列访问的7.833 %
根据查询到的资料Linux Perf 简单试用
如果存取在L1-dcache-stores命中,则不会记入cache-references,因此当程序数据局部性提升后,在L1层就已经能取到了,也就导致cache-references急剧减少,相对也就导致cache-misses/cache-references比例反而上升了
how-does-linux-perf-calculate-the-cache-references-and-cache-misses-events
If a cacheable memory access missed in the L1 and the L2, then it will be counted by cache-references. Otherwise, if it hits in the L1, then, no, it will not be counted by cache-references
可以看到,我的测试结果cache-references和cache-misses基本和LLC-loads还有LLC-load-misses能对应上
LLC全称Last Level Cache,也就是3级缓存,cache-references主要统计的是这个,所以是不全的
因此对代码的存储结构局部性优化的时候,不仅要关注cache-references和cache-misses,也需要关注L1-dcache-loads和L1-dcache-load-misses指标
不过有个很奇怪的地方是perf看不到Middle Level Cache也就是2级缓存,通过lscpu可以看到我电脑上是有的
1
2
3
4
5
~# lscpu L1d cache: 512 KiB L1i cache: 512 KiB L2 cache: 4 MiB L3 cache: 40 MiB
例子:内核执行时变量分析
对内核的tcp_sendmsg的参数和返回值进行分析
1
2
3
4
5
6
7
8
9
10
11
12
13
14
15
16
17
18
19
20
21
22
~# perf probe -V tcp_sendmsg //列出可用变量 @<tcp_sendmsg+0> int ret size_t size struct msghdr* msg struct sock* sk ~# perf probe --add 'tcp_sendmsg size' //对size进行分析 Added new event: probe:tcp_sendmsg (on tcp_sendmsg with size) ~# perf record -e probe:tcp_sendmsg -a ^C[ perf record: Woken up 1 times to write data ] [ perf record: Captured and wrote 0.068 MB perf.data (102 samples) ] ~# perf script sshd 51381 [031] 2882680.117201: probe:tcp_sendmsg: (ffffffffaf7c6cd0) size=0x34 sshd 51381 [031] 2882680.216572: probe:tcp_sendmsg: (ffffffffaf7c6cd0) size=0x34 ping 0 [024] 2882680.274319: probe:tcp_sendmsg: (ffffffffaf7c6cd0) size=0x18e sshd 51381 [031] 2882680.315973: probe:tcp_sendmsg: (ffffffffaf7c6cd0) size=0x34 sshd 51381 [031] 2882680.415371: probe:tcp_sendmsg: (ffffffffaf7c6cd0) size=0x34 sshd 51381 [031] 2882680.514757: probe:tcp_sendmsg: (ffffffffaf7c6cd0) size=0x34 ping 0 [008] 2882680.537833: probe:tcp_sendmsg: (ffffffffaf7c6cd0) size=0x2eb
甚至可以根据源码的行数,针对某个变量来分析
1
2
3
4
5
6
7
8
9
10
11
12
13
14
15
16
17
18
19
20
21
22
23
24
25
26
27
28
29
30
31
32
33
34
35
~# perf probe -L tcp_sendmsg --source /usr/src/linux-source-5.4.0/linux-source-5.4.0 <tcp_sendmsg@/usr/src/linux-source-5.4.0/linux-source-5.4.0//net/ipv4/tcp.c:0> 0 int tcp_sendmsg(struct sock *sk, struct msghdr *msg, size_t size) 1 { 2 int ret; 4 lock_sock(sk); 5 ret = tcp_sendmsg_locked(sk, msg, size); 6 release_sock(sk); 8 return ret; } EXPORT_SYMBOL(tcp_sendmsg); ~# perf probe -V tcp_sendmsg:5 Available variables at tcp_sendmsg:5 @<tcp_sendmsg+31> int ret size_t size struct msghdr* msg struct sock* sk ~# perf probe --add 'tcp_sendmsg:5 ret' Added new event: probe:tcp_sendmsg (on tcp_sendmsg:5 with ret) ~# perf record -e probe:tcp_sendmsg -a ^C[ perf record: Woken up 1 times to write data ] [ perf record: Captured and wrote 0.065 MB perf.data (88 samples) ] ~# perf script sshd 51381 [015] 2883164.805408: probe:tcp_sendmsg: (ffffffffaf7c6cef) ret=-905020008 sshd 51381 [015] 2883164.904783: probe:tcp_sendmsg: (ffffffffaf7c6cef) ret=-905020008 python3 55841 [028] 2883164.959670: probe:tcp_sendmsg: (ffffffffaf7c6cef) ret=-913736176 python3 55841 [028] 2883164.959734: probe:tcp_sendmsg: (ffffffffaf7c6cef) ret=-913736176
例子:调度器分析
检查进程在调度器的切换次数,调度时延等等
1
2
3
4
5
6
7
8
9
10
11
12
13
14
~# perf sched record -- sleep 1 [ perf record: Woken up 1 times to write data ] [ perf record: Captured and wrote 2.208 MB perf.data (19037 samples) ] ~# perf sched latency ----------------------------------------------------------------------------------------------------------------- Task | Runtime ms | Switches | Average delay ms | Maximum delay ms | Maximum delay at | ----------------------------------------------------------------------------------------------------------------- :33539:33539 | 0.101 ms | 10 | avg: 0.010 ms | max: 0.031 ms | max at: 2883308.367008 s :140:140 | 0.012 ms | 1 | avg: 0.010 ms | max: 0.010 ms | max at: 2883307.615766 s :30434:30434 | 0.016 ms | 1 | avg: 0.010 ms | max: 0.010 ms | max at: 2883308.366990 s :33562:33562 | 0.105 ms | 10 | avg: 0.008 ms | max: 0.014 ms | max at: 2883307.666567 s :33556:33556 | 0.129 ms | 10 | avg: 0.008 ms | max: 0.025 ms | max at: 2883307.866712 s
总结
本篇简单介绍了perf的使用,有一些高级用法仅做简单了解,以防不时之需
参考资料
关于缓存原理
在优化缓存利用率的时候对缓存原理做了一些简单了解,参考资料记录在下面